
Crypto Surge Alert: Bitcoin Eyes $200K by 2025, Altcoins Poised to Skyrocket
The crypto market is buzzing with excitement as Bitcoin (BTC) charges toward a monumental $200,000 price target by the end of 2025. Institutional investment in spot Bitcoin ETFs is pouring in, and altcoins are flashing breakout signals. Which coins are ready to ride the wave on Kucoin?
Let’s dive into the hottest price predictions backed by technical analysis and fresh CoinMarketCap data.
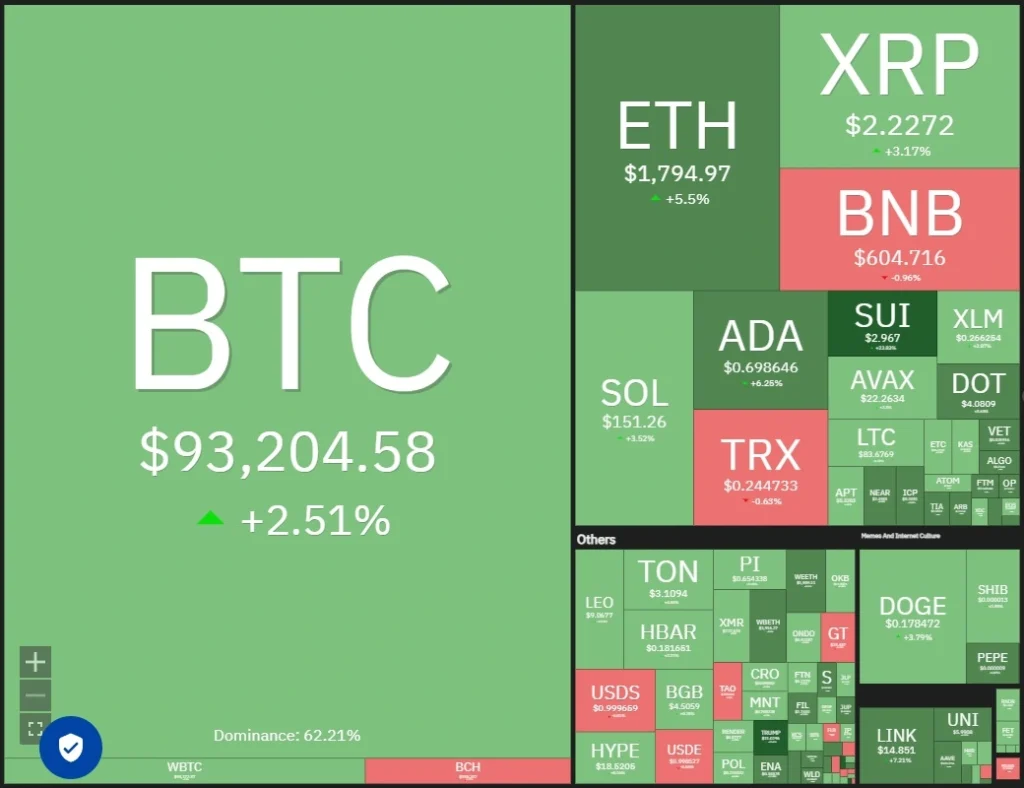
Bitcoin (BTC): The King’s Rally to $200K
- Price: $93,487
- ETF Inflows: $381.3M (Apr 21) | $912.7M (Apr 22)
- Analyst Forecast: Standard Chartered, Intellectia AI → $200K by 2025
Technical Outlook:
- Bull Case: Break above $95,000 → $100,000 → $107,000
- Bear Case: Drop below 20-day EMA ($85,773) could crash the setup
- Caution: RSI near overbought; Doji candlestick (Apr 23) shows indecision
- Contrarian View: 10x Research warns low stablecoin minting could stall momentum
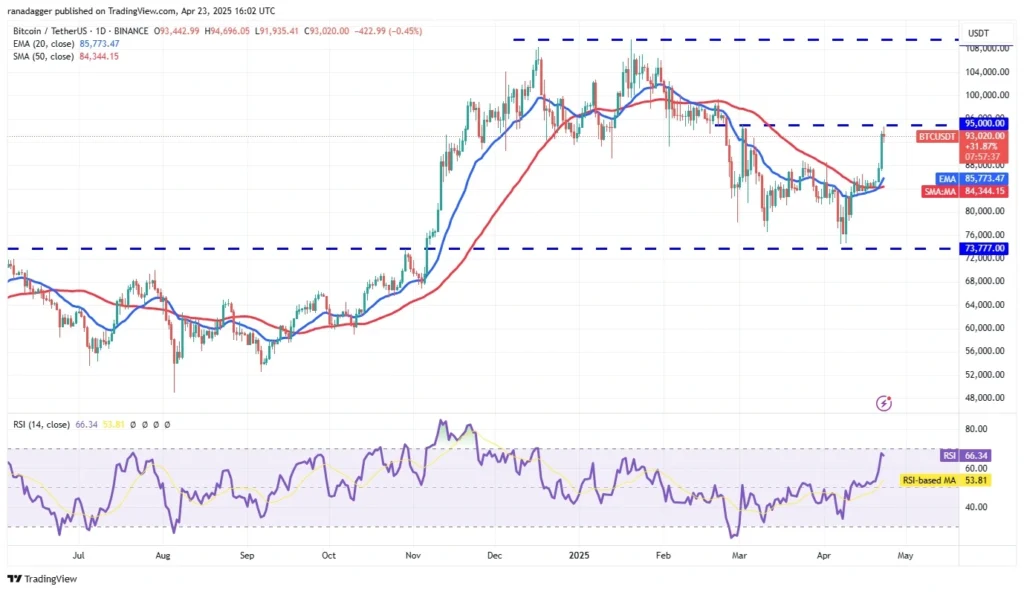
On April 23, Bitcoin displayed a Doji candlestick pattern, reflecting hesitation between bulls and bears around the $95,000 resistance level. The 20-day EMA ($85,773) is beginning to slope upward, and the RSI is approaching overbought territory, indicating a bullish tilt. If buyers hold their ground against sellers, the odds of breaking past $95,000 improve significantly, potentially propelling the BTC/USDT pair to $100,000 and then $107,000. However, this optimistic outlook could falter if the price reverses sharply from $95,000 and drops below the moving averages.
Ether (ETH): Ready to Reclaim $2,500?
- Price: $1,762
- Key Levels: 20-day EMA = $1,676 | 50-day SMA = $1,830
Technical Outlook:
- Bull Case: Break above $1,830 → $2,111 → $2,550
- Bear Case: Rejection at $2,111 traps ETH in $1,368–$2,111 zone
- RSI: Gaining bullish momentum
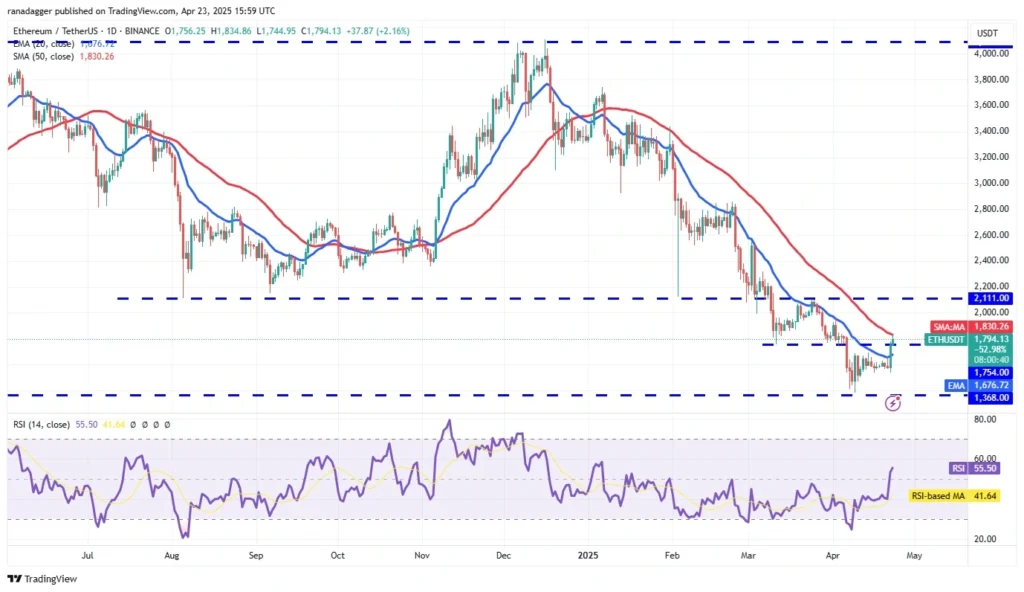
Ethereum (ETH), priced at $1,767, surged notably on April 22, climbing above its 20-day EMA ($1,676). Buyers are now aiming to maintain momentum by driving the price past the 50-day SMA ($1,830) on April 23. Success here could see the ETH/USDT pair leap to the key resistance at $2,111. While sellers may attempt to halt the advance at this level, a bullish breakout could push ETH toward $2,550, signaling the end of its corrective phase. On the flip side, a sharp rejection at $2,111 would suggest bears are still dominant, potentially trapping the pair in a range between $2,111 and $1,368 for an extended period.
XRP: Trend Change on the Horizon?
- Price: $2.19
- Resistance: 50-day SMA = $2.20
Technical Outlook:
- Bull Case: Close above resistance → $3 breakout
- Bear Case: Drop below moving averages → $2 retest
- Note: Long wick on Apr 23 candlestick hints sellers are active
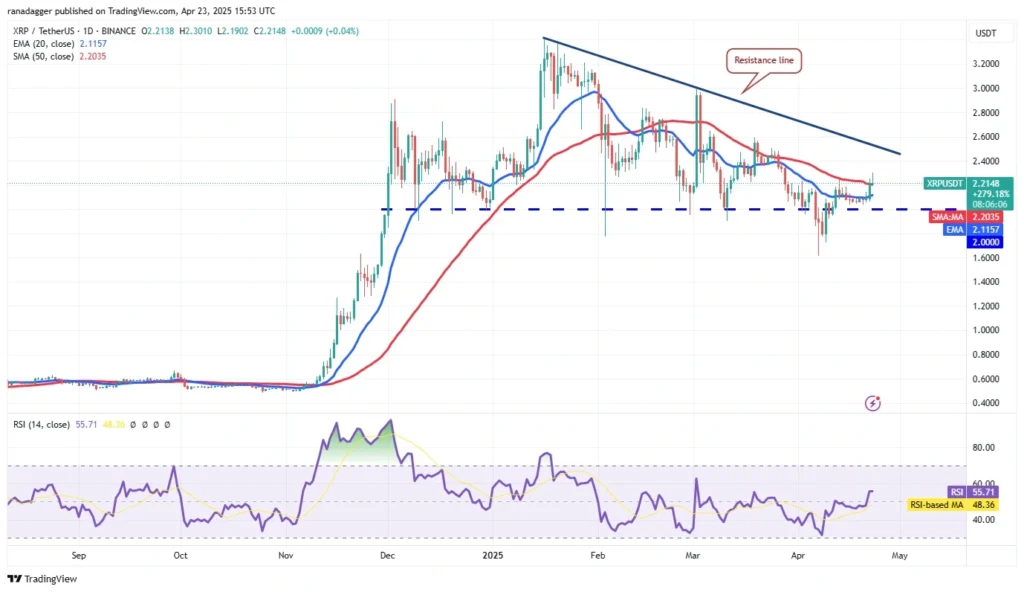
XRP, trading at $2.19, pushed above its 50-day SMA ($2.20), though a long candlestick wick indicates selling pressure at higher levels. Bears are likely to fiercely guard the resistance line, as a decisive close above it could herald a trend reversal, potentially driving the XRP/USDT pair toward $3. Conversely, if the price reverses and falls below the moving averages, it would signal continued bearish control, with XRP likely retesting the $2 support level, where buyers are expected to step in.
BNB: Breakout or Bull Trap?
- Price: $600.79
- Market Cap: $84.64B | 24h Volume: $1.56B
Technical Outlook:
- Bull Case: Bounce from averages → $644 → $680
- Bear Case: Break below support = bull trap → $566
- FDV = Market Cap → Strong valuation backing current rally
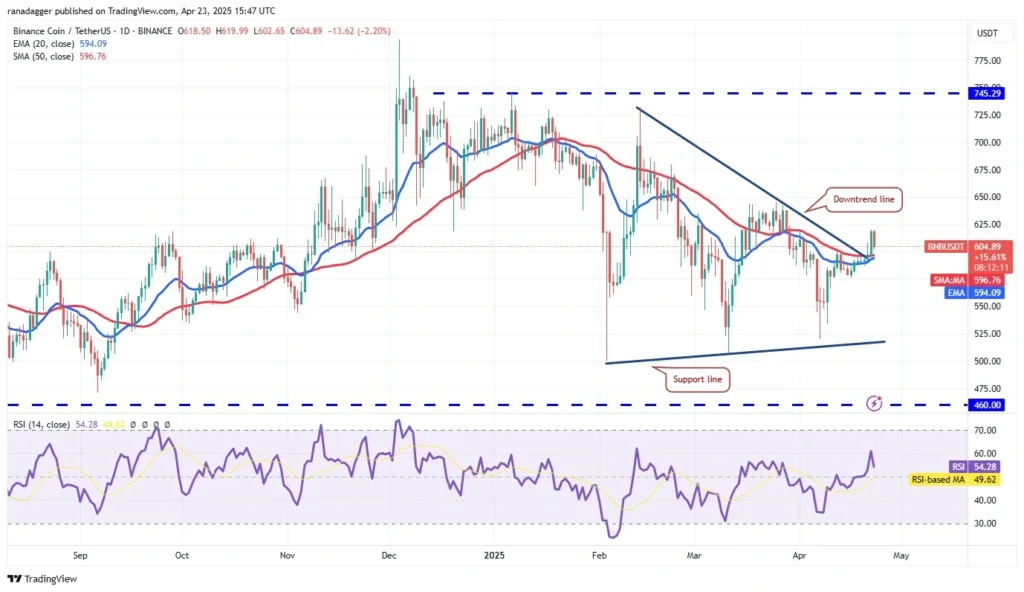
BNB, priced at $599.81, surged past its downtrend line on April 21, but bears are pushing back with strong selling at elevated levels. The BNB/USDT pair might retreat to the moving averages, a critical short-term support to monitor. A robust bounce from this level could boost the chances of a rally to $644, and potentially $680. However, if the price breaks and closes below the moving averages, it could signal that the breakout was a false move, risking a drop to $566.
Solana (SOL): $180 in Sight
- Price: $151.33
- Market Cap: $78.3B | 24h Volume: $3.83B
- FDV: $90.7B
Technical Outlook:
- Bull Case: Close above $153 → $180 possible
- Bear Case: Drop below averages = back to $110–$120
- Indicators: RSI positive | 20-day EMA rising
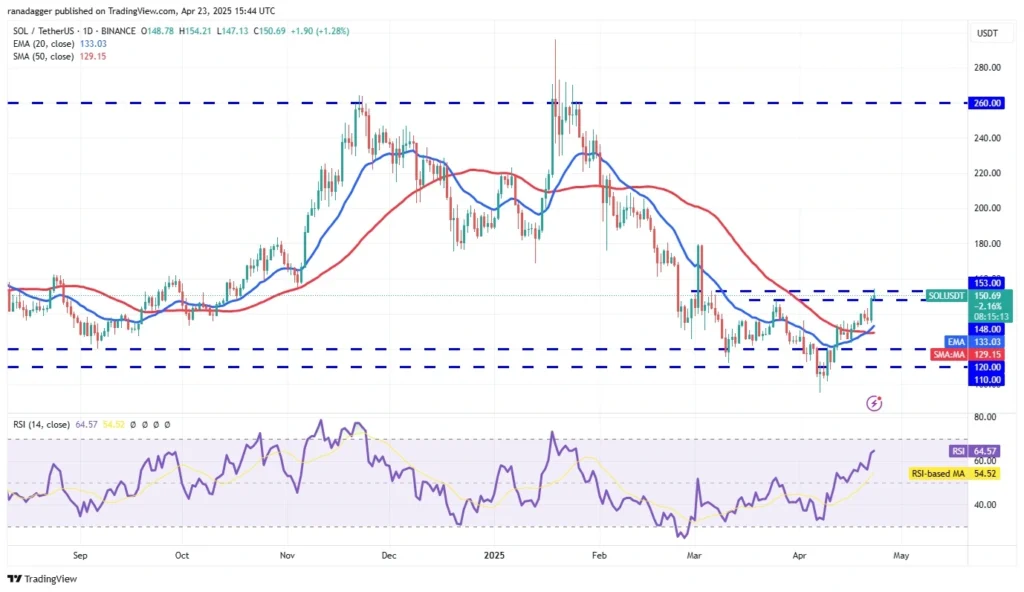
Solana SOL $151.18 rebounded off the 20-day EMA ($133) on April 22 and is attempting to climb above the overhead resistance at $153 on April 23. The 20-day EMA is sloping up, and the RSI is in the positive territory, indicating an advantage to buyers. A close above $153 clears the path for a rally to $180. Such a move brings the large $110 to $260 range into play. Time is running out for the bears. If they want to make a comeback, they will have to swiftly pull the price below the moving averages. If they do that, the SOL/USDT pair could plunge to the $120 to $110 support zone.

Dogecoin (DOGE): Double-Bottom Breakout?
- Price: $0.1806
- Market Cap: $26.7B | 24h Volume: $1.42B
- FDV: $26.7B
Technical Outlook:
- Bull Case: Break above $0.21 → $0.28
- Bear Case: Drop = range-bound in $0.14–$0.21
- Wildcard: DOGE still defying logic, fueled by memes and momentum
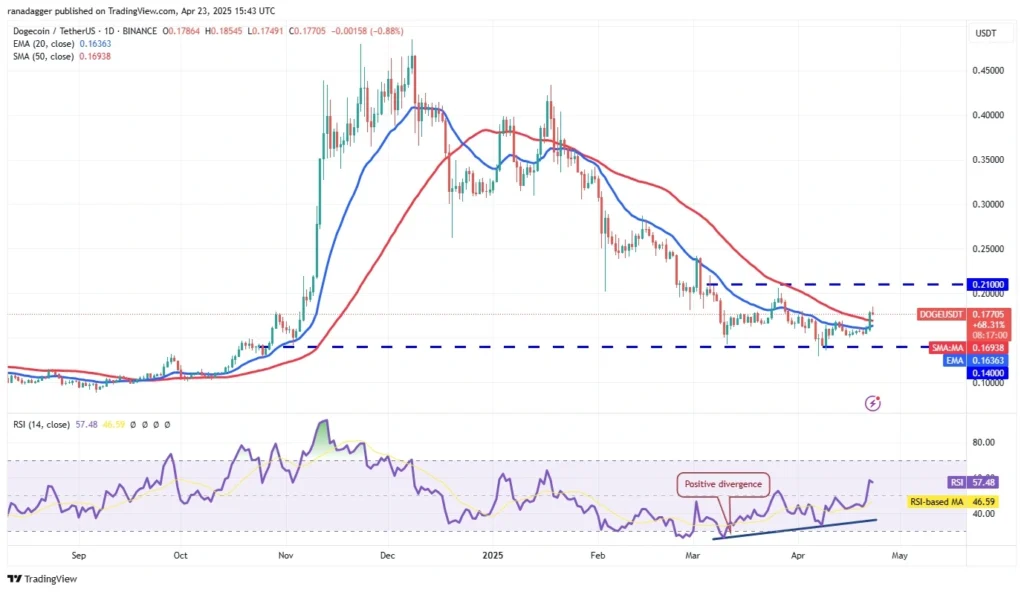
Dogecoin (DOGE), priced at $0.1805, surged past its moving averages on April 22, signaling a bullish resurgence. The price may climb to the $0.21 resistance, where bears are likely to mount a defense. If DOGE retreats from $0.21 and falls below the moving averages, it could indicate near-term consolidation, with the DOGE/USDT pair oscillating between $0.14 and $0.21. On the other hand, a decisive close above $0.21 would confirm a double-bottom pattern, potentially driving the pair toward a target of $0.28.
Cardano (ADA): Momentum Shifts Up
- Price: $0.7173
- Market Cap: $25.32B | 24h Volume: $1.02B
- FDV: $32.28B
Technical Outlook:
- Bull Case: Break 50-day SMA ($0.68) → $0.83
- Bear Case: Drop to $0.58 → possible dip to $0.50
- Momentum: RSI entering bullish territory
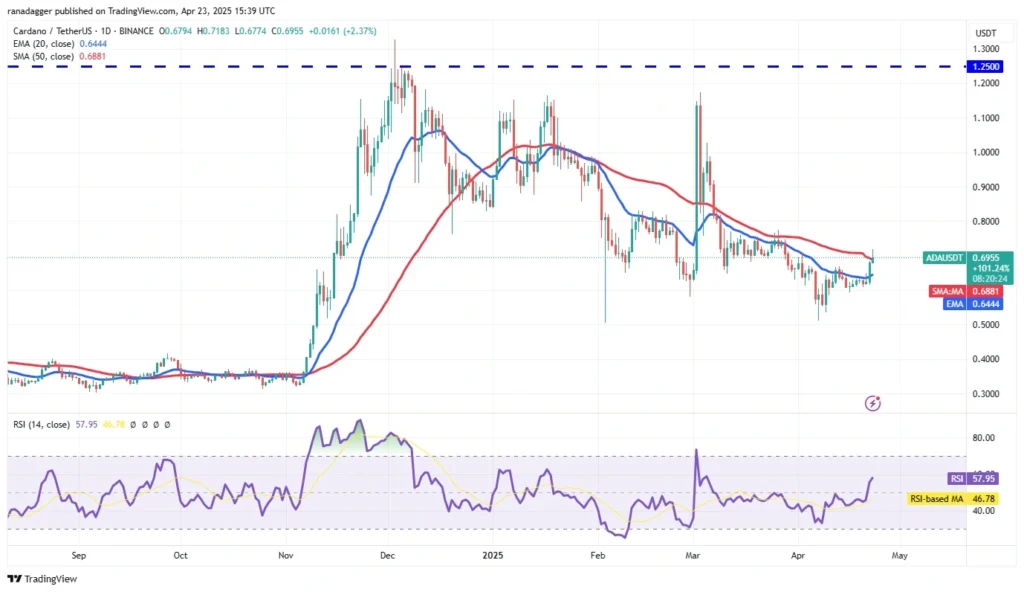
Cardano (ADA), trading at $0.7184, was propelled above its 20-day EMA ($0.64) on April 22, with buyers now striving to hold the price above the 50-day SMA ($0.68) on April 23. Although the 20-day EMA remains flat, the RSI has shifted into bullish territory, signaling growing upward momentum. A sustained close above the 50-day SMA could trigger a rally to $0.83. Buyers are likely to protect the $0.58–$0.64 zone on any pullbacks. However, if sellers manage to push the ADA/USDT pair below $0.58, they could regain control, potentially driving the price down to $0.50.
Chainlink (LINK): Channel Breakout Looms
- Price: $14.97
- Market Cap: $9.83B | 24h Volume: $421.87M
- FDV: $14.97B
Technical Outlook:
- Bull Case: Push to $16 → Channel breakout → Trend reversal
- Bear Case: Fall below 20-day EMA = risk of $11.89 retest
- Momentum: Holding above both moving averages
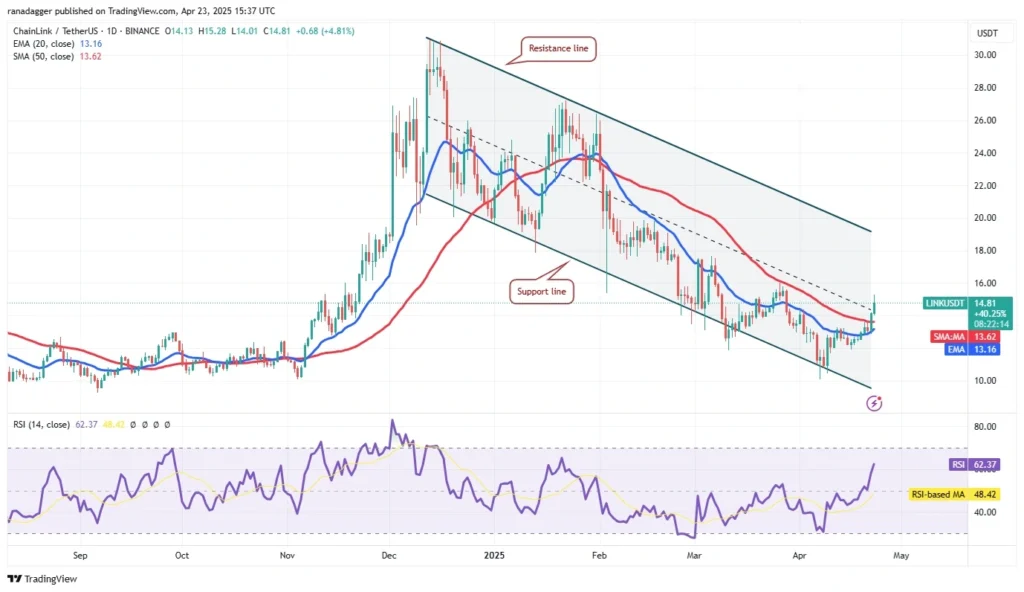
Chainlink (LINK), priced at $14.99, rebounded from its 20-day EMA ($13.16) and climbed above the 50-day SMA ($13.62) on April 22. The LINK/USDT pair may now target $16, where bears are likely to put up a fierce fight. If buyers can prevent a drop below the 20-day EMA, the chances of a push toward the resistance line of the descending channel pattern increase, with a breakout above the channel signaling a trend reversal. The 20-day EMA remains a key support level to monitor. A break below it could trigger a decline to $11.89, and potentially further to the channel’s support line.
Avalanche (AVAX): Double-Bottom Setup
- Price: $22.30
- Market Cap: $9.28B | 24h Volume: $328.54M
- FDV: $15.96B
Technical Outlook:
- Bull Case: Breakout above $23.50 → $31.73 target
- Bear Case: Fall below 20-day EMA ($19.72) = Rangebound $15.27–$23.50
- Pattern: Double-bottom forming
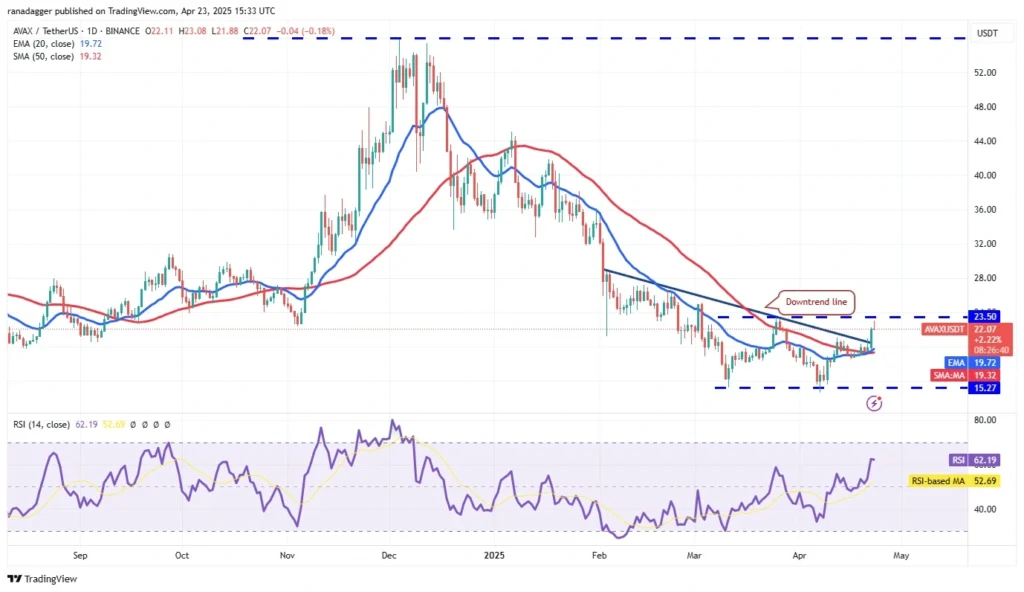
Avalanche (AVAX), trading at $22.30, broke through its downtrend line on April 22, suggesting that bearish pressure is waning. Bears are likely to defend the $23.50 level fiercely, as a failure to do so would complete a double-bottom pattern for the AVAX/USDT pair, targeting $31.73. Should the price retreat from $23.50, bulls are expected to step in and buy dips near the 20-day EMA ($19.72). A strong rebound from this level would bolster the chances of surpassing $23.50. Conversely, a drop below the moving averages could trap AVAX in a range between $15.27 and $23.50.

Sui (SUI): The Altcoin Star
- Price: $3.29
- Market Cap: $10.71B | 24h Volume: $2.94B
- FDV: $33.07B
Technical Outlook:
- Bull Case: Break $3.25 → $3.50 surge
- Bear Case: Drop below 20-day EMA ($2.29) = potential consolidation
- Note: Massive 11.53% daily gain — breakout confirmed
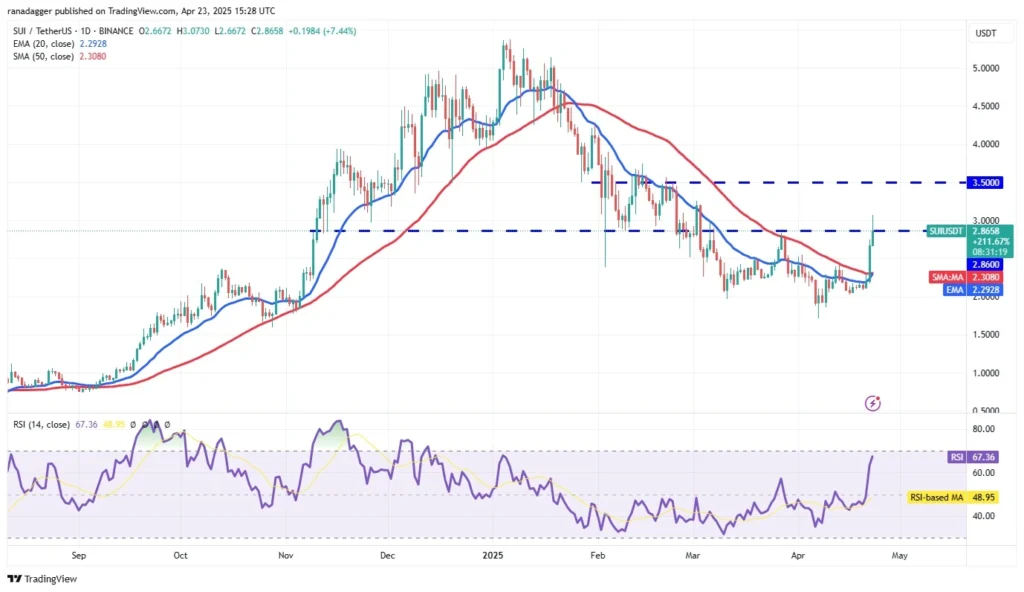
Sui (SUI), priced at $3.30, surged past its moving averages on April 22 and cleared the $2.86 resistance on April 23. Despite a long candlestick wick indicating selling pressure above $2.86, sustained bullish strength could lead to a breakout above this level, driving the SUI/USDT pair toward $3.25 and potentially $3.50. The 20-day EMA ($2.29) is likely to serve as a robust support during any pullbacks. However, a break and close below this EMA would signal fading bullish momentum, possibly leading to a near-term range-bound pattern.
Final Take
The crypto bulls are back in the driver’s seat, and if the trend holds, we could be looking at a massive rally by late 2025. Bitcoin’s ETF-powered march to $200K is just the beginning — altcoins are poised to deliver serious gains if key resistance levels break.
Which coin are you watching the closest? Drop your pick in the comments or tag us on X!
Ready to ride the wave? Buy your favorite altcoins now on Coinbase— get up to 50 USDC on your first deposit.
Want to see how your investments grow? Check out our Compound Interest Calculator and run the numbers.
Protect your crypto the smart way — read our comparison of Trezor vs Ledger and choose the right hardware wallet for you.
Data sourced from CoinMarketCap and CoinGecko as of April 24, 2025. Always conduct your own research before investing.
Disclaimer: The content on this website is for informational and educational purposes only and should not be considered financial, investment, or legal advice. We are not financial advisors, and the opinions expressed here are not a substitute for professional financial guidance. Cryptocurrency investments carry significant risks, including the potential for financial loss. Always conduct your own research and consult with a qualified financial advisor before making any investment decisions. We are not responsible for any financial losses or damages resulting from the use of the information provided on this site. This post contains affiliate links and we may earn a commission if you sign up, at no extra cost to you.





Post Comment